Look, I’m going to be straight with you.
Most SaaS companies are drowning in data but starving for actual insights.
You’ve got dashboards everywhere. Google Analytics showing traffic numbers. Your CRM spitting out lead counts. Stripe telling you about revenue. But here’s the thing, none of it’s connected. And that disconnection is costing you real money.
I’ve worked with dozens of SaaS companies over the years, and the pattern’s always the same. Marketing teams celebrate traffic wins while the CFO’s wondering why burn rate keeps climbing. Sales teams hit their quotas, but six months later, half those customers have churned. Product ships features nobody uses, and customer success is firefighting instead of driving expansion.
Sound familiar?
The reality is this: SaaS SEO metrics aren’t just about rankings and clicks anymore. They’re about understanding the complete journey from organic visitor to profitable, retained customer and everything that happens in between.
In this guide, I’m breaking down the 15 critical SaaS metrics you actually need to track in 2025. Not the vanity stuff. The metrics that tell you whether your business is actually healthy, whether your customer acquisition is sustainable, and whether you’re building something that’ll still be around in three years.
And if you’re looking to build a comprehensive organic growth strategy around these metrics, check out my guide on developing a data-driven SaaS SEO strategy.
We’re talking Monthly Recurring Revenue, churn rates, Customer Lifetime Value, CAC payback periods, the whole works. And more importantly, I’ll show you exactly how to connect your SEO efforts to these business outcomes.
Because at the end of the day, organic traffic means nothing if it’s not driving revenue.
Let’s dive in.
Why SaaS Metrics Are Different (And Why That Matters)
Here’s what trips up most people coming from traditional business backgrounds.
SaaS metrics work completely differently than regular business metrics.
In a traditional business, you sell something once, collect payment, and you’re done. Simple math. But SaaS? You’re selling a promise of ongoing value. Your customer pays you monthly (or annually), and they can leave whenever they want.
This changes everything.
Your revenue isn’t “earned” until you’ve delivered value consistently over time. That $100/month customer who signs up today? They might be worth $12,000 over ten years, or they might churn next month and be worth $100 total.
You won’t know which until it happens.
This is why subscription-based metrics became essential for SaaS companies. You need to understand not just how much money you’re making today, but how predictable that revenue stream is, how long customers stick around, and what it actually costs you to acquire and retain them.
According to Bessemer Venture Partners’ State of the Cloud report, the median SaaS company now spends $2.00 in sales and marketing to acquire $1.00 of new annual recurring revenue. That ratio has increased 14% in just the last year.
Translation? Customer acquisition is getting more expensive, and if you’re not tracking the right metrics, you’re flying blind.
The Revenue Recognition Problem
Let me give you a real example.
You sign a customer to a $12,000 annual contract. Awesome, right? You just made twelve grand!
Not so fast.
In SaaS accounting, you can’t recognize that $12,000 as revenue today. You have to spread it across the twelve months of service delivery. So you’ve got $1,000 in MRR (Monthly Recurring Revenue) from that customer.
But here’s where it gets interesting for your business health: if that customer churns in month three, you only actually earned $3,000 from that relationship. All the acquisition costs you spent to get them. The ad spend, the sales time, the onboarding effort got amortized against a much smaller revenue base than you expected.
This is why tracking MRR, ARR, and churn isn’t optional. It’s the only way to understand if your business model actually works.
The Organic Search Advantage (That Nobody Talks About)
Here’s something I’ve seen consistently across every SaaS company I’ve worked with:
Customers acquired through organic search have fundamentally better unit economics than customers from any other channel.
Why?
Because people who find you through search are already looking for a solution. They’re researching. Comparing options. They’ve got intent. They’re not interruption-based prospects who saw your ad while scrolling LinkedIn, they’re actively in buying mode.
The data backs this up. Organic search customers typically show:
- 2-4 percentage points lower churn rates than paid channel customers
- Higher expansion revenue because they self-select for product fit
- Lower support costs because they’ve already done their research
- Better LTV:CAC ratios (often 5:1 vs 2.5:1 for paid channels)
This is exactly why SEO is critical for SaaS businesses. It’s not just about traffic, it’s about acquiring fundamentally better customers.
But… and this is a big but….. you only capture this advantage if you’re measuring it correctly.
Most SaaS companies lump all their customers together and calculate blended metrics. They have no idea that their organic customers are subsiding their paid acquisition channels. They can’t see that the SEO content they invested in six months ago is now generating customers at a 6:1 LTV:CAC ratio.
So they underfund organic growth and overfund paid channels.
Don’t be that company.
The Financial Core: Revenue Metrics That Actually Matter
Let’s start with the foundation, the financial metrics that every investor, board member, and CFO cares about.
These are your business health indicators. Get these wrong, and nothing else matters.
Monthly Recurring Revenue (MRR): Your Revenue Heartbeat
MRR is the most important number in your business.
Period.
It represents the predictable, recurring revenue you expect to collect every single month from your active subscribers. Not one-time fees. Not professional services. Just the recurring subscription revenue.
The basic calculation is simple:
MRR = Number of Customers × Average Revenue Per Account (ARPA)
So if you’ve got 500 customers paying an average of $200/month, your MRR is $100,000.
But here’s where most people stop and where they miss the good stuff.
Smart SaaS companies don’t just track total MRR. They track MRR movement. Because understanding why your MRR changed tells you everything about your business health.
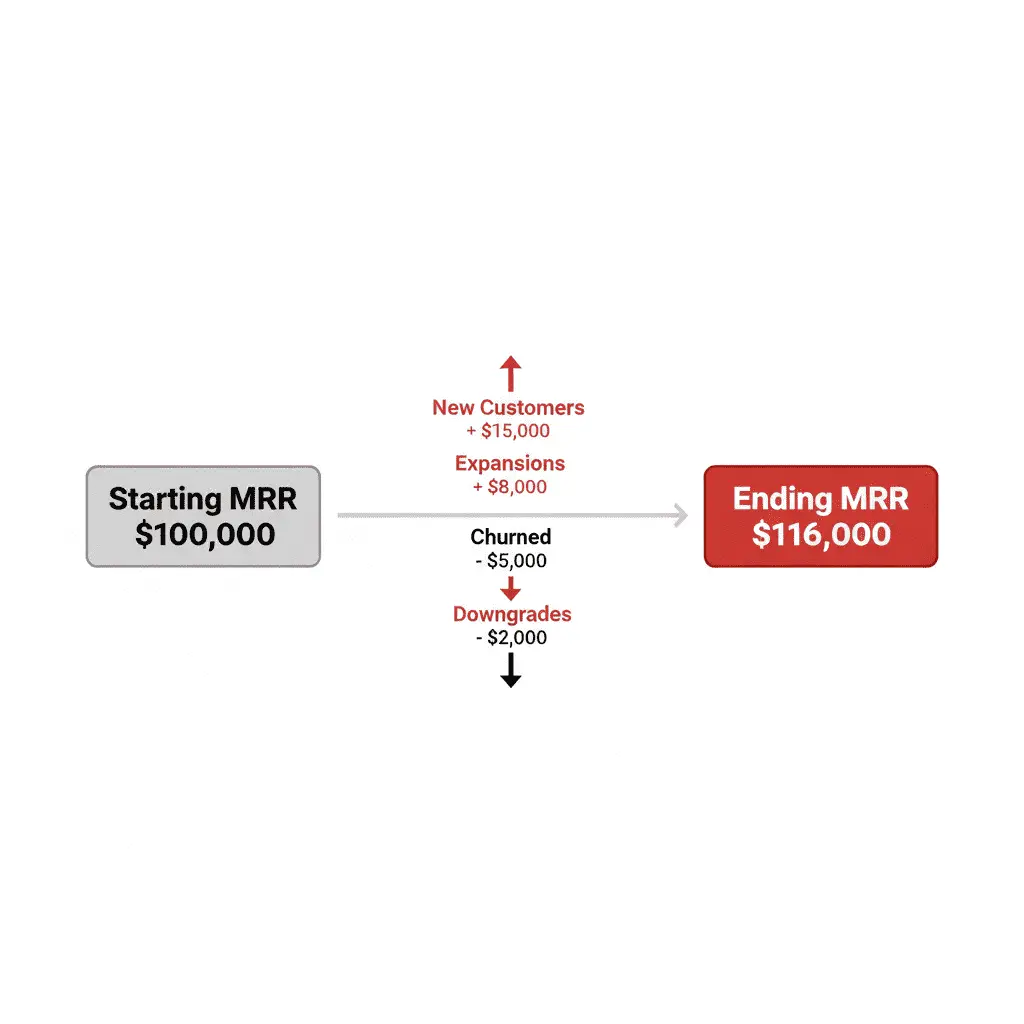
Every month, your MRR changes based on four components:
New MRR: Revenue from brand new customers Expansion MRR: Additional revenue from existing customers (upgrades, add-ons, more seats) Churned MRR: Revenue lost from customers who cancelled Contraction MRR: Revenue lost from customers who downgraded
Your Net New MRR formula looks like this:
Net New MRR = New MRR + Expansion MRR – Churned MRR – Contraction MRR
Let’s say this month you:
- Added $15,000 in new customer MRR
- Generated $8,000 in expansion from existing customers
- Lost $5,000 from customers who cancelled
- Lost $2,000 from downgrades
Your Net New MRR = $15,000 + $8,000 – $5,000 – $2,000 = $16,000
That’s healthy growth. But the composition tells you more than the total.
If most of your growth comes from new customers and you’ve got high churn, you’re running on a treadmill. You’re constantly replacing lost revenue instead of building on your base.
If you’re generating significant expansion MRR and keeping churn low, you’ve got a compounding growth engine. Each new customer doesn’t just maintain your MRR, they have potential to grow it over time.
For SEO specifically, you want to track how much New MRR comes from organic channels.
If you’re investing $10,000/month in content and SEO, and that’s generating $15,000 in new MRR from organic customers each month, you’ve got a 1.5X immediate return before factoring in the long-tail value of that content.
That’s the kind of insight that justifies doubling down on organic.
For early-stage companies, this becomes even more critical. Learn more about SEO strategies specifically for SaaS startups to maximize these returns from day one.
Annual Recurring Revenue (ARR): The Big Picture View
ARR is just your MRR multiplied by 12.
Simple math: $100,000 MRR = $1,200,000 ARR.
But ARR becomes more useful as you scale because it’s the language investors and acquirers speak. When someone asks about your “run rate,” they’re asking about ARR.
It’s also the baseline for calculating most of your efficiency metrics (which we’ll get to in a minute).
One critical distinction: Companies with annual contracts sometimes calculate ARR differently than companies with monthly billing. If you’ve got annual contracts, your ARR is the total contract value normalized to an annual basis.
Example: You sign a two-year deal worth $50,000 total. That’s $25,000 ARR, not $50,000.
Why does this matter? Because when you’re comparing your metrics to industry benchmarks or talking to investors, you need to be calculating ARR the same way everyone else does.
Most SaaS benchmarking data uses consistent ARR calculation methodology, so make sure you’re speaking the same language.
Customer Acquisition Cost (CAC): What You’re Really Paying for Growth
CAC is where most companies lie to themselves.
Not intentionally. But they exclude costs that absolutely should be included, and they end up with artificially low CAC numbers that make their unit economics look way better than reality.
The proper CAC formula is:
CAC = (Total Sales & Marketing Expenses) ÷ (Number of New Customers Acquired)
But “Total Sales & Marketing Expenses” needs to include everything:
- Salaries and benefits for your entire sales and marketing team
- All paid advertising (Google, LinkedIn, Facebook, the works)
- Marketing software and tools (CRM, email, analytics, etc.)
- Content creation costs (writers, designers, agencies)
- Events, conferences, and sponsorships
- Allocated overhead (office space, equipment, etc.)
Be honest about these numbers. I’ve seen companies exclude their VP of Marketing’s salary from CAC calculations. Come on.
Also critical: distinguish between Blended CAC and New Customer CAC.
Blended CAC includes expansion revenue in the denominator. New Customer CAC only counts, well, new customers.
For most strategic decisions, you want New Customer CAC. It tells you the actual cost to acquire someone new, which is what you need to know when deciding whether to increase acquisition spending.
Let’s say you spent $200,000 on sales and marketing last month. You acquired 100 new customers and generated $50,000 in expansion revenue from existing customers.
Blended CAC = $200,000 ÷ (100 new customers + expansion counted as equivalent customers) = lower number, less useful
New Customer CAC = $200,000 ÷ 100 = $2,000 per customer
That $2,000 figure is what you need to compare against Customer Lifetime Value to understand if your acquisition is sustainable.
According to recent data from SaaS Capital’s 2025 benchmarks, median New CAC Ratio (dollars spent to generate $1 of new ARR) is now $2.00 across B2B SaaS companies. Top quartile performers achieve $1.25 or better.
Where do you stack up?
Customer Lifetime Value (CLV or LTV): The True Worth of a Customer
This is where everything comes together.
CLV represents the total gross profit you expect to generate from a customer over their entire relationship with your company.
The standard formula:
CLV = (ARPA × Gross Margin %) ÷ Monthly Churn Rate
Let’s break this down with real numbers:
- ARPA (Average Revenue Per Account): $200/month
- Gross Margin: 70% (after hosting and delivery costs)
- Monthly Churn Rate: 3%
CLV = ($200 × 0.70) ÷ 0.03 = $140 ÷ 0.03 = $4,667
This means each customer is worth $4,667 in gross profit over their lifetime.
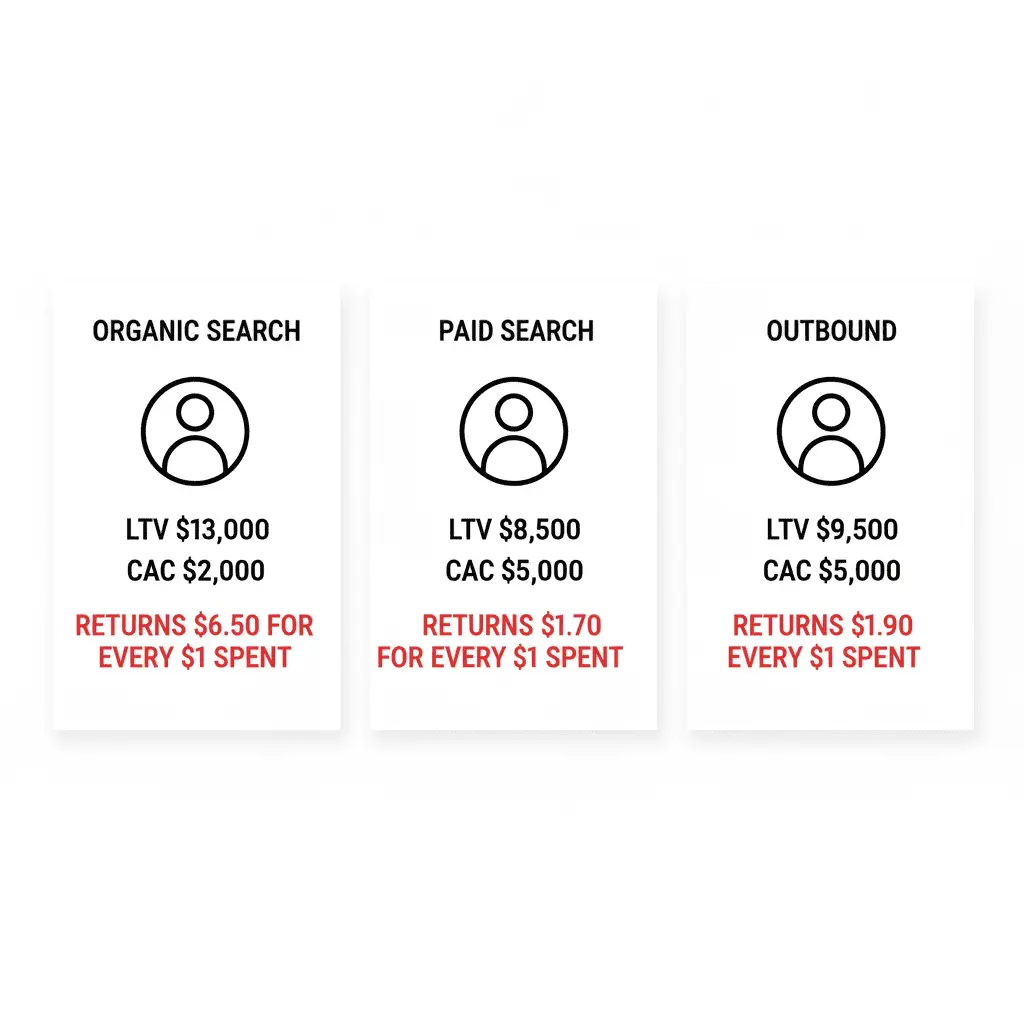
But here’s what makes this powerful: different acquisition channels produce customers with different LTVs.
When you track CLV by channel, you discover things like:
- Organic search customers: $5,200 average CLV (lower churn, better fit)
- Paid search customers: $3,800 average CLV (higher churn, less qualified)
- Outbound sales: $6,500 average CLV (higher ACV, more sticky)
This channel-specific CLV data completely changes how you allocate budget.
If your organic customers have 37% higher LTV than paid customers, and your organic CAC is lower too (which it usually is), the case for investing heavily in SEO and content becomes overwhelming.
One critical note: The simple CLV formula assumes static churn and ARPA. But in reality, your best customers expand over time through upgrades and add-ons.
More sophisticated CLV calculations factor in expansion revenue:
CLV = (ARPA × Gross Margin %) ÷ (Monthly Churn Rate – Monthly Expansion Rate)
This gives you a more accurate picture, especially if you’ve got strong net negative churn (which we’ll cover next).
I help SaaS companies at ricardorodriguezz.com build these channel-specific CLV models so they know exactly where to invest their growth dollars. Because without this data, you’re just guessing.
Revenue Quality: Churn, Retention, and What Actually Keeps the Lights On
Making money is one thing. Keeping it is another.
This is where most SaaS companies discover whether they’ve actually built something valuable or just an expensive customer acquisition hamster wheel.
Revenue Churn: The Silent Business Killer
Revenue churn measures how much MRR you lose each month from cancellations and downgrades.
Formula:
Gross Revenue Churn Rate = (Churned MRR) ÷ (Beginning of Month MRR)
If you started the month with $100,000 MRR and lost $4,000 to churn, your gross revenue churn is 4%.
That might not sound terrible. But let’s do the math on what 4% monthly churn means:
After 12 months, you’ve lost 48% of your starting MRR to churn (roughly, the actual math is a bit more complex due to compounding, but you get the idea).
That means you need to replace nearly half your revenue base every year just to stand still.
Now you see why churn matters so much.
Acceptable churn rates vary by price point:
- Enterprise SaaS ($100K+ ACV): 5-7% annual churn is good
- Mid-market SaaS ($10K-$100K ACV): 10-15% annual churn is acceptable
- SMB SaaS (sub-$10K ACV): 15-25% annual churn is the harsh reality
If you’re selling to small businesses at $50/month, they go out of business, switch tools frequently, and have higher natural churn. That’s not a failure, it’s the market reality. You just need expansion revenue and efficient acquisition to overcome it.
Here’s where it gets interesting: Net Revenue Churn.
Net Revenue Churn = (Churned MRR – Expansion MRR) ÷ Beginning MRR
If you lost $4,000 to churn but gained $5,000 in expansion revenue from existing customers, your net revenue churn is -1%.
Negative churn. You actually grew revenue from your existing customer base without acquiring a single new customer.
This is the holy grail of SaaS metrics.
Companies achieving consistent negative net churn have built compounding growth machines. According to Bessemer’s cloud benchmarks, top-quartile SaaS companies achieve net revenue retention of 115-120%, meaning their existing customer base grows 15-20% annually through expansion.
For your organic SEO strategy, you want to track churn rates by acquisition channel.
I consistently see organic customers churn 2-4 percentage points lower than paid channel customers. Why? They self-selected. They researched. They understood what they were buying.
If you can prove your organic customers churn less, you’ve got ammunition to shift budget from paid to organic channels.
Net Revenue Retention (NRR): The Growth Quality Metric Investors Actually Care About
NRR has become the single most important metric for SaaS company valuation.
Seriously. Investors care about NRR more than growth rate now.
Formula:
NRR = [(Beginning MRR – Churned MRR – Contraction MRR + Expansion MRR) ÷ Beginning MRR] × 100
Let’s say you started a quarter with $1M MRR from existing customers:
- Lost $50K to churn
- Lost $20K to downgrades
- Gained $150K from upsells and expansion
NRR = [($1M – $50K – $20K + $150K) ÷ $1M] × 100 = 108%
You grew 8% from your existing customer base alone.
Why investors love this metric:
NRR above 100% means you can grow without acquiring a single new customer. It proves you’ve built something people find increasingly valuable over time. It shows pricing power, product-market fit, and expansion opportunities all in one number.
Recent SaaS benchmarks show:
- Median NRR across B2B SaaS: 102-104%
- Top quartile: 115-120%
- Best-in-class (like Snowflake, Datadog): 130%+
If you’re below 100% NRR, you’re shrinking from your existing customer base. You’re replacing churn plus trying to grow. That’s exhausting and expensive.
If you’re above 110% NRR, you’ve got something special.
The expansion playbook requires content too.
Most SaaS companies obsess over top-of-funnel SEO content to acquire customers. They forget that existing customers are Googling their product name plus “advanced features” or “integrations” or “enterprise options.”
If you’re not ranking for those expansion-intent searches, you’re leaving expansion revenue on the table.
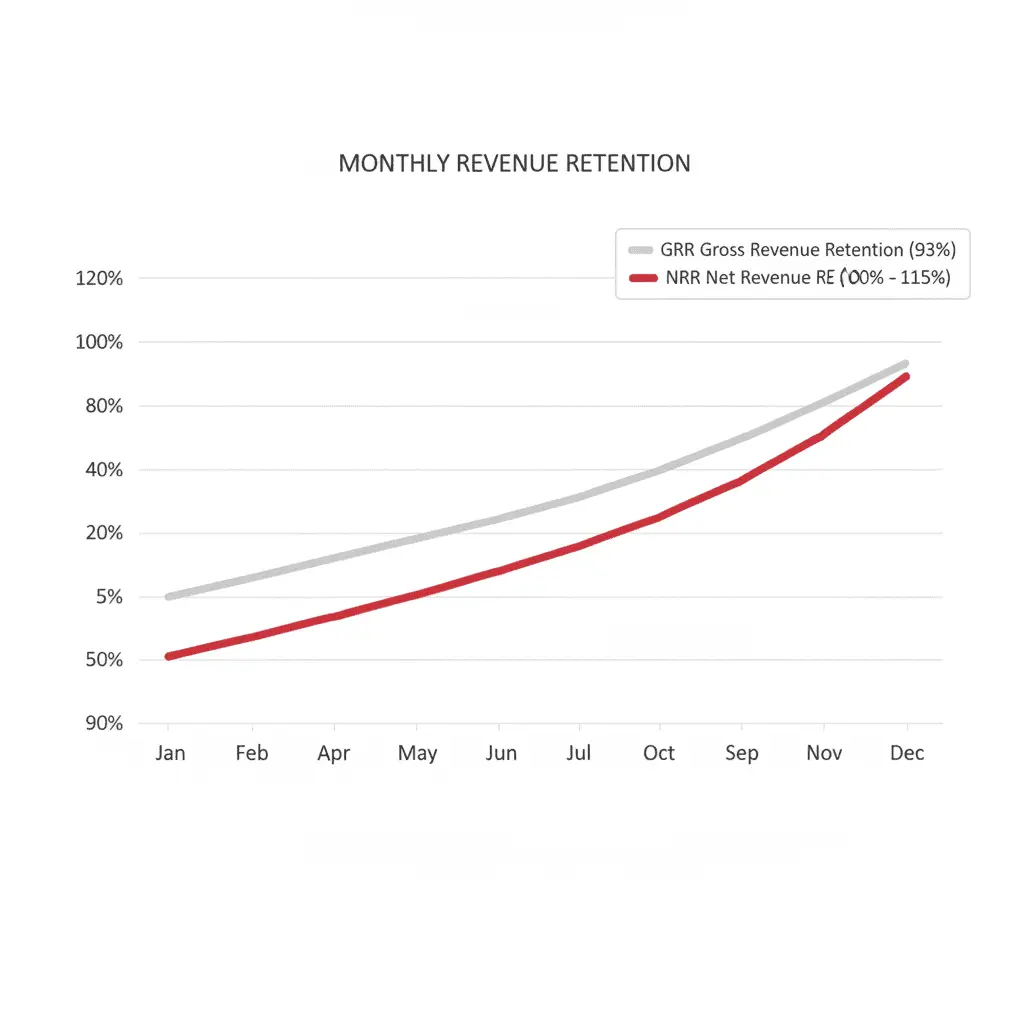
Gross Revenue Retention (GRR): The Baseline Retention Reality Check
While NRR gets all the attention, GRR is actually more diagnostic.
GRR ignores expansion revenue and just tells you: what percentage of revenue did you keep?
Formula:
GRR = [(Beginning MRR – Churned MRR – Contraction MRR) ÷ Beginning MRR] × 100
Using our earlier example with $1M starting MRR, $50K churn, and $20K downgrades:
GRR = [($1M – $50K – $20K) ÷ $1M] × 100 = 93%
You retained 93% of your revenue before expansion.
Here’s why this matters:
You can have great NRR but terrible GRR if you’re only growing through expansion in a shrinking customer base. That’s not sustainable long-term.
Strong companies achieve both:
- GRR of 90%+ (you’re retaining almost everyone)
- NRR of 110%+ (and they’re expanding significantly)
Weak companies show:
- GRR of 75-85% (bleeding revenue to churn)
- NRR of 95-105% (expansion barely covering churn)
The SMB reality check:
If you’re selling to small businesses, accept that GRR will be lower. SMBs go out of business at higher rates, have tighter budgets, and churn more frequently for reasons completely unrelated to your product quality.
The median GRR for SMB-focused SaaS is around 85-90%. For enterprise, it’s 90-95%.
Know your market and benchmark accordingly.
Growth Efficiency: Understanding If You Can Afford to Scale
Revenue is sexy. Efficiency is profitable.
Most SaaS companies focus on growth rate and celebrate ARR milestones. But growth means nothing if it’s burning cash unsustainably.
These efficiency metrics tell you whether your business model actually works at scale.
CAC Payback Period: How Long Until You Break Even on a Customer
This metric answers one critical question: How many months until the gross profit from a new customer repays what you spent to acquire them?
Formula:
CAC Payback Period (months) = CAC ÷ (ARPA × Gross Margin %)
Let’s use realistic numbers:
- CAC: $1,500
- ARPA: $250/month
- Gross Margin: 75%
CAC Payback = $1,500 ÷ ($250 × 0.75) = $1,500 ÷ $187.50 = 8 months
After 8 months, this customer has generated enough gross profit to repay their acquisition cost. Everything after month 8 is profit.
Industry benchmarks vary by deal size:
- PLG/Self-serve SaaS: 6-12 months is healthy
- Mid-market SaaS: 12-18 months is acceptable
- Enterprise SaaS: 18-24 months (longer sales cycles justify this)
According to SaaS Capital’s benchmarks, median CAC payback across all SaaS companies is approximately 12-15 months, with top-quartile companies achieving 8-10 months.
Why this matters for cash flow:
If your CAC payback is 12 months and you’re growing fast, you need enough cash to fund an entire year of customer acquisition before those customers repay their costs.
Fast growth with long payback periods = massive cash consumption.
This is why efficient, capital-light growth is so valuable. If you can reduce CAC payback from 15 months to 9 months, you cut your working capital requirements nearly in half.
The organic search advantage strikes again:
Because organic acquisition amortizes content costs over many months and many customers, organic CAC payback is typically 30-40% shorter than paid channel payback.
A customer acquired through paid search might have 14-month payback. The same customer profile acquired through organic might show 9-month payback because the cost to acquire them was lower.
This difference compounds dramatically as you scale.
The LTV:CAC Ratio: Your Business Model Viability Score
If I could only track one efficiency metric, it’d be this one.
The LTV:CAC ratio tells you how much lifetime value you generate for every dollar spent on acquisition.
Formula:
LTV:CAC = Customer Lifetime Value ÷ Customer Acquisition Cost
If your CLV is $4,500 and your CAC is $1,500, your ratio is 3:1.
Industry standard targets:
- 3:1 is the minimum acceptable ratio for sustainable SaaS
- 4:1 or higher indicates excellent unit economics
- Below 2.5:1 means you’re in trouble
- Above 5:1 suggests you’re underinvesting in growth
Here’s how to interpret these scenarios:
LTV:CAC of 2:1 or lower: Your business model might not work. You’re spending too much to acquire customers relative to what they’re worth. Fix your CAC (more efficient channels) or your LTV (reduce churn, increase prices) immediately.
LTV:CAC of 3:1: You’re in the acceptable zone. Your unit economics work. But there’s not much cushion for error or market shifts.
LTV:CAC of 4-5:1: Goldilocks zone. Healthy margins, sustainable growth, room for investment and experimentation.
LTV:CAC of 6:1 or higher: Counterintuitively, this might mean you’re underinvesting in customer acquisition. If your returns are this good, you could probably spend more on acquisition and still maintain healthy economics while growing faster.
The channel-specific insight that changes everything:
When I work with SaaS companies, we calculate LTV:CAC by acquisition channel. The results are always eye-opening.
Typical pattern:
- Organic search: 5-6:1 LTV:CAC ratio
- Paid search: 2.5-3:1 ratio
- Display ads: 2:1 ratio (often unprofitable)
- Outbound sales: 4-5:1 ratio (for enterprise deals)
Suddenly, the budget allocation question answers itself.
If organic drives 5:1 returns and paid drives 2.5:1, you should be massively reallocating budget to organic, even if the absolute volume is smaller initially.
But most companies never run this analysis. They just blend everything together and miss the insights.
The Rule of 40: Balancing Growth and Profitability
The Rule of 40 has become the standard for evaluating overall SaaS company health.
Formula:
Rule of 40 Score = Revenue Growth Rate (%) + EBITDA Margin (%)
If you’re growing 30% year-over-year with 15% EBITDA margins, your score is 45. You pass.
If you’re growing 50% with -20% margins, your score is 30. You’re burning too much cash for your growth rate.
What this really measures:
The Rule of 40 captures the fundamental trade-off between growth and profitability. You can grow fast while burning cash, or grow slowly while being profitable. Both can be fine. But the combination matters.
According to recent benchmarking data, bootstrapped SaaS companies significantly outperform venture-backed companies on Rule of 40 metrics:
- Bootstrapped median: 40-50
- VC-backed median: 20-35
Why? Bootstrapped companies maintain profitability while growing. VC-backed companies sacrifice profitability to chase growth, often inefficiently.
Neither approach is inherently wrong. But the Rule of 40 keeps you honest about whether your growth is sustainable.
For SEO investment decisions:
Organic growth strategies typically improve your Rule of 40 score because they drive efficient growth. Lower CAC means better margins. Compounding content value means growth without proportional cost increases.
If you’re a bootstrapped company trying to hit Rule of 40 scores of 50+, organic-led growth is often the only way to get there. You can’t outspend competitors in paid channels, but you can out-execute them in content and SEO.
Customer Engagement: Leading Indicators That Predict Revenue Outcomes
Everything we’ve covered so far is backward-looking.
Churn happened. Revenue came in. CAC was spent.
But what if you could predict these outcomes before they happen?
That’s what engagement and product metrics do. They’re early warning systems telling you which customers will churn, which will expand, and which will become advocates.
Net Promoter Score (NPS): The Loyalty Metric That Actually Correlates
NPS gets dismissed as a vanity metric.
It’s not.
When tracked consistently and acted upon, NPS correlates strongly with retention, expansion revenue, and even organic growth through word-of-mouth.
How it works:
You ask customers: “On a scale of 0-10, how likely are you to recommend [product] to a friend or colleague?”
Then you categorize responses:
- Promoters (9-10): Love your product, will refer others
- Passives (7-8): Satisfied but not enthusiastic
- Detractors (0-6): Unhappy, might churn or damage your brand
NPS Formula:
NPS = % Promoters – % Detractors
If 50% of respondents are promoters, 40% are passives, and 10% are detractors:
NPS = 50 – 10 = 40
Interpreting NPS scores:
- Above 50: Excellent (top-tier product-market fit)
- 20-50: Good (room for improvement)
- 0-20: Acceptable (significant issues to address)
- Below 0: Crisis (more detractors than promoters)
Bain & Company research shows that companies with NPS scores 20+ points above their industry average grow revenue 2x faster than competitors.
The actionable part:
Don’t just calculate NPS. Segment it.
- NPS by customer cohort (when they signed up)
- NPS by plan/pricing tier
- NPS by acquisition channel
- NPS by feature usage patterns
- NPS by time to first value
These segments reveal why some customers love you and others don’t.
I’ve seen companies discover their organic-acquired customers have NPS scores 15-20 points higher than paid-acquired customers. That’s not coincidence, it’s self-selection and expectation alignment.
The SEO connection:
If your NPS is low, your content might be misrepresenting what your product does. You’re attracting the wrong people or setting unrealistic expectations.
If your NPS is high among organic customers, double down on the content that’s attracting them. You’ve found product-market-content fit.
Feature Adoption Rate: The Leading Indicator of Retention
Here’s a pattern I’ve seen dozens of times:
Customers who adopt key features within their first 30 days have 3-5x lower churn rates than customers who don’t.
Feature adoption predicts retention better than almost any other metric.
Formula:
Feature Adoption Rate = (# of Active Users Using Feature ÷ Total Active Users) × 100
If you’ve got 1,000 active users and 350 have used your [critical feature], your adoption rate is 35%.
Why this matters:
Low feature adoption means:
- Customers don’t understand your product’s value
- Your onboarding is failing
- The feature isn’t actually that valuable (ouch)
High feature adoption means:
- Customers are getting value
- Switching costs are increasing (they’re invested)
- Expansion opportunities exist (power users want more)
Track adoption across feature categories:
Not all features are created equal. Categorize them:
- Core features: Essential functionality (high adoption expected)
- Power features: Advanced capabilities (moderate adoption expected)
- Integration features: Third-party connections (adoption varies)
- Experimental features: New releases (low adoption initially)
A healthy SaaS product shows:
- 80%+ adoption of core features
- 30-50% adoption of power features
- Growing adoption of successful new features
- Declining adoption of features you should deprecate
The content opportunity:
If you’ve got a valuable feature with low adoption, you don’t have a product problem. You have an education problem.
Create content showing:
- What the feature does and why it matters
- Step-by-step tutorials on using it
- Use cases and real examples
- ROI/value demonstration
This content serves both SEO (people search for these capabilities) and customer success (existing customers need to learn this stuff).
Win-win.
Customer Health Score: Predicting Churn Before It Happens
Customer health scoring is where SaaS companies are getting sophisticated.
Instead of waiting for churn to happen, you build a predictive model that assigns each account a “health score” based on multiple factors.
Typical health score inputs:
Product usage:
- Login frequency
- Feature adoption
- Active user count
- Usage trends (increasing or decreasing)
Engagement signals:
- Email opens and clicks
- In-app message responses
- Support ticket volume and sentiment
- Community participation
Financial indicators:
- Payment history
- Plan/pricing tier
- Expansion revenue history
- Time since last renewal
Support and success:
- Tickets opened (and resolved)
- Customer success meeting attendance
- NPS responses
- Account executive notes
You weight these factors and calculate a composite score (often 0-100).
Typical scoring:
- 80-100: Healthy (low churn risk, expansion opportunity)
- 60-79: Stable (monitor, nurture)
- 40-59: At risk (intervention needed)
- 0-39: Critical (immediate action required)
What makes this powerful:
Health scores let you prioritize customer success efforts. Instead of spreading resources equally, you focus on:
- Healthy accounts → Drive expansion
- At-risk accounts → Prevent churn
- Critical accounts → Emergency intervention
Leading SaaS companies report that predictive health scores achieve 85%+ accuracy in predicting churn 3-6 months in advance.
That’s enough time to intervene and save 30-50% of predicted churns.
The automation angle:
Health scores also drive automated playbooks:
- Account drops below 60 → Trigger email campaign with success stories
- Account reaches 85+ → Customer success reaches out about expansion
- Usage drops 30% month-over-month → Automated check-in + tutorial content
This is where content marketing and customer success merge. Your content becomes part of the retention infrastructure, not just the acquisition engine.
Product Metrics: Understanding What Drives Engagement and Growth
Revenue metrics tell you what happened. Product metrics tell you why.
These are the behavioral indicators that predict whether you’ve built something people actually want to use.
Daily Active Users (DAU) and Monthly Active Users (MAU): The Engagement Foundation
DAU and MAU measure how many unique users are actively engaging with your product on a daily and monthly basis.
Why both matter:
DAU measures habitual usage. MAU measures reach.
The relationship between them (DAU/MAU ratio) tells you how “sticky” your product is.
DAU/MAU Ratio = Daily Active Users ÷ Monthly Active Users
If you have 3,000 DAU and 10,000 MAU, your ratio is 30%.
That means 30% of your monthly user base is active on any given day.
Interpreting DAU/MAU:
- 50%+ : Extremely sticky (daily habit product like Slack)
- 30-50%: High engagement (several times per week)
- 20-30%: Moderate engagement (weekly usage)
- Below 20%: Low engagement (monthly or occasional use)
Not every SaaS product needs high DAU/MAU. It depends on your use case.
An invoicing tool might have 15% DAU/MAU because people invoice monthly or weekly, not daily. That’s fine.
But a project management tool with 15% DAU/MAU has a problem. Teams should be in there every day.
What impacts DAU/MAU:
- Product category (collaboration tools should be higher)
- Target persona (individual vs. team usage)
- Use case frequency (daily workflows vs. periodic tasks)
- Competitive alternatives (switching costs and habit formation)
The growth connection:
Products with high DAU/MAU ratios typically show:
- Lower churn (users are invested)
- Higher NPS (daily value creation)
- Better expansion revenue (power users need more)
- Stronger word-of-mouth (people talk about daily habits)
If your DAU/MAU is declining, it’s an early warning signal. Users are getting less value or finding alternatives.
Customer Engagement Score: Synthesizing Activity Into Actionable Insights
Engagement scores take multiple behavioral signals and compress them into a single metric.
Typical components:
Activity frequency:
- Login days per month
- Sessions per login
- Time spent in product
Feature utilization:
- Number of features used
- Depth of usage in each feature
- Adoption of new capabilities
Collaboration indicators:
- Team members added
- Shared artifacts (documents, boards, etc.)
- Cross-functional usage
Value-driving actions:
- Tasks completed
- Projects shipped
- Integrations activated
- Workflow automation created
Each component gets weighted based on what your data shows correlates with retention.
Example scoring model:
| Component | Weight | Score (0-10) | Weighted Score |
| Login frequency | 30% | 8 | 2.4 |
| Feature adoption | 25% | 6 | 1.5 |
| Team collaboration | 20% | 9 | 1.8 |
| Value actions | 25% | 7 | 1.75 |
| Total Engagement Score | 7.45/10 |
Using engagement scores strategically:
Segment customers by engagement level and tailor your approach:
High engagement (8-10):
- Expansion sales outreach
- Beta feature invitations
- Case study requests
- Referral program invites
Medium engagement (5-7):
- Best practice content
- Feature education campaigns
- Community invitations
- Success story social proof
Low engagement (0-4):
- Onboarding refresh campaigns
- Value realization content
- Customer success check-ins
- Churn prevention offers
This targeted approach beats spraying the same content at everyone.
Time to Value (TTV): The Metric That Determines Onboarding Success
How long does it take a new user to experience meaningful value from your product?
That’s your Time to Value, and it’s one of the most critical metrics for retention.
Why TTV matters:
Users decide whether to keep using your product within days (sometimes hours) of signing up. If they don’t get value fast, they leave.
Research shows:
- 30% of SaaS users churn within the first 30 days
- Most churn decisions are made in the first week
- Users who reach a value milestone in the first session are 3x more likely to become long-term customers
Defining your value milestones:
Your “value moment” varies by product:
- Project management tool: Creating and completing the first task
- Analytics platform: Viewing the first meaningful report
- Email marketing tool: Sending the first campaign
- CRM: Adding contacts and logging the first activity
Identify what action signals “they get it” for your product.
Measuring TTV:
TTV = Time from signup to [value milestone]
Track the median and distribution:
- Median TTV: 3 days (half your users reach value within 3 days)
- 25th percentile: 1 day (fast adopters)
- 75th percentile: 7 days (slower adopters)
Optimization goal:
Reduce TTV aggressively. The faster users get value, the better your retention.
Companies that reduce median TTV from 7 days to 2 days often see:
- 30-50% reduction in early-stage churn
- Higher trial-to-paid conversion rates
- Better NPS scores
- Increased feature adoption downstream
The content role in reducing TTV:
Onboarding content directly impacts TTV:
- Getting started guides
- Video walkthroughs
- Interactive tutorials
- Template libraries
- Best practice frameworks
This content shouldn’t be hidden in your help docs. It should be:
- Visible in your product (in-app guides)
- Sent via email (onboarding sequences)
- Available via search (SEO-optimized support content)
When users Google “[your product] how to get started,” they should find crystal-clear guidance that speeds them to value.
The Saas SEO Metric Tool Stack I Recommend
For most SaaS companies, here’s the practical stack:
Early stage ($0-$1M ARR):
- Baremetrics or ProfitWell (revenue metrics)
- Google Analytics (website and traffic)
- Mixpanel or Amplitude (product analytics)
Growth stage ($1M-$10M ARR):
- ChartMogul (revenue analytics)
- Amplitude (product analytics)
- Salesforce or HubSpot (CRM with pipeline metrics)
- Looker or Metabase (custom dashboards pulling from all sources)
Scale stage ($10M+ ARR):
- Maxio or custom data warehouse (financial infrastructure)
- Amplitude or Pendo (product analytics)
- Salesforce (CRM)
- Looker or Tableau (BI platform)
- Custom data engineering team maintaining metrics
The key is integration. Your revenue metrics platform needs to talk to your CRM, which needs to connect to your product analytics, which needs to feed into your BI dashboards.
I help SaaS companies build these integrated metrics stacks so they can actually make data-driven decisions instead of drowning in disconnected tools.
Connecting SEO Strategy to SaaS Business Outcomes
Here’s where everything comes together.
All these metrics we’ve covered, MRR, churn, LTV, CAC, NRR. They’re not separate from your SEO strategy.
They ARE your SEO strategy.
Or at least they should be.
Why Traditional SEO Metrics Don’t Matter (For SaaS)
Most SEO professionals still measure success with traffic and rankings.
“We increased organic traffic 40% this quarter!”
Cool. Did revenue increase?
“We’re ranking #1 for 47 keywords now!”
Great. How many of those rankings drove actual customers?
“Our domain authority improved from 42 to 48!”
Wonderful. What’s the ROI?
Here’s the uncomfortable truth: traffic, rankings, and domain authority are not business outcomes.
They’re inputs. Activities. Potential leading indicators.
But in SaaS, the only thing that matters is:
- Did we acquire profitable customers?
- Did those customers stick around?
- Did they expand their spend?
- Can we sustainably scale this?
Every other metric is vanity.
The Revenue-Aligned SEO Framework
Here’s how to actually measure SEO success in SaaS:
Tier 1 Metrics (What Actually Matters):
- Organic MRR contribution (new MRR from organic customers)
- Organic CAC (fully-loaded cost to acquire customer via organic)
- Organic LTV:CAC ratio (compared to other channels)
- Organic customer churn rate (do organic customers retain better?)
- Organic NRR (do organic customers expand more?)
Tier 2 Metrics (Leading Indicators):
- MQL volume from organic search
- Organic visitor-to-MQL conversion rate
- MQL-to-customer conversion rate by channel
- Average deal size by acquisition channel
- Time-to-close by channel
Tier 3 Metrics (Diagnostic/Directional):
- Organic traffic volume (qualified traffic only)
- Keyword rankings (commercial intent keywords)
- Content performance (pages driving conversions)
- Backlink acquisition (to key commercial pages)
Notice the hierarchy. Business outcomes first. Leading indicators second. Traditional SEO metrics last.
Calculating Organic SEO ROI (The Right Way)
Most companies don’t know their SEO ROI because they don’t track the full attribution chain.
Here’s the calculation:
Step 1: Calculate total SEO investment
Include everything:
- Content creation costs (writers, editors, designers)
- SEO tools and software (Ahrefs, SEMrush, etc.)
- Technical SEO work (developer time, page speed optimization)
- Link building and PR costs
- SEO team salaries (or consultant fees, hint hint)
Let’s say that totals $15,000/month.
Step 2: Track customers acquired from organic
Use UTM parameters, CRM source tracking, and attribution tools to identify customers whose first touch was organic search.
Let’s say you acquired 25 customers from organic this quarter.
Step 3: Calculate the value of those customers
Average LTV of organic customers: $4,800 Total LTV from 25 customers: $120,000
Step 4: Calculate ROI
Quarterly SEO investment: $15,000 × 3 = $45,000 LTV from organic customers: $120,000
ROI = (LTV – Investment) ÷ Investment = ($120,000 – $45,000) ÷ $45,000 = 167% ROI
But wait, that’s just quarter one.
The content you created this quarter will continue generating traffic and customers for months or years. So the actual ROI compounds over time.
By month 12, that same $45K investment might have generated $300K+ in customer LTV.
That’s why SEO is so powerful for SaaS. The returns compound. Paid ads stop the second you turn off the spend. Content keeps working.
Tracking AI and LLM Traffic
With the rise of AI search engines like Perplexity and ChatGPT Search, you need to track more than just traditional Google traffic. I’ve written detailed guides on:
- How to track AI traffic in GA4 to measure LLM referrals
- How to rank in AI search engines to capture this growing channel
- How to rank on Perplexity specifically
- LLM SEO vs Traditional SEO to understand the strategic differences
AI search traffic often converts at different rates than traditional organic search, so segment this traffic separately in your attribution model.
Channel-Specific Metrics: The Insights Everyone Misses
Most SaaS companies calculate blended metrics across all customers.
Blended CAC. Blended LTV. Blended churn.
This hides the massive differences in channel performance.
Here’s what channel-specific analysis reveals:
| Metric | Organic Search | Paid Search | Outbound Sales |
| Avg CAC | $800 | $2,200 | $3,500 |
| Avg LTV | $5,200 | $3,800 | $6,500 |
| LTV:CAC | 6.5:1 | 1.7:1 | 1.9:1 |
| Churn Rate | 3.2% | 6.8% | 4.1% |
| CAC Payback | 8 months | 16 months | 14 months |
Look at that difference.
Organic customers have:
- 3.8x better LTV:CAC than paid search
- 52% lower churn
- 50% faster payback
If you’re allocating budget based on “reach” or “volume” instead of these economics, you’re literally burning money.
The action item:
Set up attribution tracking in your CRM that captures:
- First touch source (how did they find you initially)
- Last touch source (what drove them to convert)
- Channel-specific LTV (track actual revenue by cohort)
- Channel-specific churn (do they stick around?)
Then run the analysis quarterly and reallocate budget to channels with the best LTV:CAC ratios.
It’s not sexy. But it’s how you build a profitable SaaS company.
Content Strategy Aligned to Metrics
Traditional content strategy focuses on keyword volume and traffic potential.
Revenue-aligned content strategy focuses on commercial value and conversion potential.
The framework:
Before diving into content prioritization, make sure you’ve completed thorough keyword research for SEO to identify which topics actually drive conversions for your business.
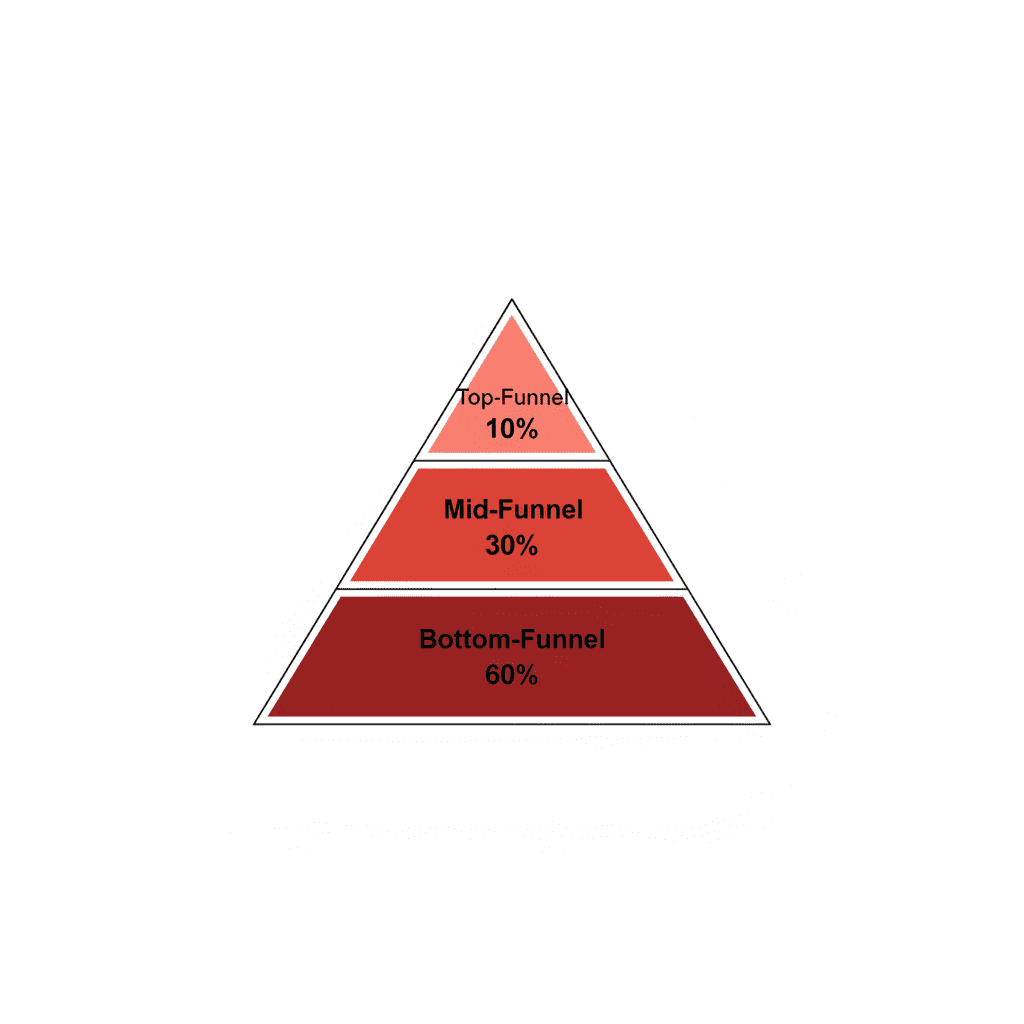
Tier 1: Bottom-of-funnel content (highest priority)
- Target keywords: [competitor] alternative, [product category] pricing, best [solution] for [use case]
- Content types: Comparison pages, product-led landing pages, pricing guides
- Conversion rate: 5-15% visitor to MQL
- Volume: Lower, but quality is exceptional
- Example: “Asana vs Monday.com: Which Project Management Tool for SaaS Teams?”
To identify which competitors are winning these high-intent searches, run a comprehensive SEO competitive analysis to find content gaps and opportunities.
Tier 2: Mid-funnel content (high priority)
- Target keywords: How to [solve problem], [process] best practices, [solution] guide
- Content types: Ultimate guides, frameworks, templates, case studies
- Conversion rate: 2-5% visitor to MQL
- Volume: Moderate, qualified traffic
- Example: “How to Build a Product Roadmap: Complete Guide for SaaS Product Managers”
Tier 3: Top-of-funnel content (moderate priority)
- Target keywords: What is [concept], [trend] statistics, [industry] challenges
- Content types: Definitional content, statistics roundups, trend analysis
- Conversion rate: 0.5-2% visitor to MQL
- Volume: High traffic, low qualification
- Example: “What is Product-Led Growth? Definition, Examples, and Statistics”
Most SaaS companies spend 70% of their content budget on Tier 3 and wonder why SEO isn’t driving revenue.
Flip it. Spend 60% of budget on Tier 1 and 2 content that converts.
Once you’ve prioritized your content topics, focus on execution quality. My guide on how to write SEO content that converts covers the frameworks that turn keywords into revenue-driving articles.
Building Authority for Your SaaS Content
While domain authority is a vanity metric, strategic link acquisition to your high-converting content pages absolutely impacts rankings and traffic. Learn the techniques that actually work in my guide on how to get backlinks without resorting to spammy tactics.
SaaS Metrics Benchmarks: Where You Should Be in 2025
Numbers without context are meaningless.
Is 5% monthly churn good or bad? Depends on your market, pricing, and customer segment.
Here are the 2025 benchmarks so you know where you stand.
Financial Metrics by Company Stage
Seed/Early Stage ($0-$1M ARR):
- Growth rate: 100-200% year-over-year
- Net Revenue Retention: 100-110%
- New Customer CAC Ratio: $1.50-$3.00 per dollar of new ARR
- Gross margin: 70-80%
- Rule of 40: Typically negative (prioritizing growth)
Growth Stage ($1M-$10M ARR):
- Growth rate: 50-100% YoY
- Net Revenue Retention: 105-115%
- New Customer CAC Ratio: $1.50-$2.50
- Gross margin: 75-82%
- Rule of 40: 30-50
Scale Stage ($10M-$50M ARR):
- Growth rate: 30-60% YoY
- Net Revenue Retention: 105-120%
- New Customer CAC Ratio: $1.00-$2.00
- Gross margin: 77-85%
- Rule of 40: 40-60
Enterprise Stage ($50M+ ARR):
- Growth rate: 20-40% YoY
- Net Revenue Retention: 100-115%
- New Customer CAC Ratio: $0.75-$1.50
- Gross margin: 78-87%
- Rule of 40: 45-65
Source: SaaS Capital 2025 Benchmarks
Retention Benchmarks by Market Segment
SMB SaaS (ACV <$5,000):
- Annual logo retention: 75-85%
- Gross revenue retention: 85-92%
- Net revenue retention: 90-105%
- Monthly churn: 3-6%
Mid-Market SaaS (ACV $5,000-$50,000):
- Annual logo retention: 85-92%
- Gross revenue retention: 88-95%
- Net revenue retention: 100-115%
- Monthly churn: 1.5-3%
Enterprise SaaS (ACV $50,000+):
- Annual logo retention: 90-97%
- Gross revenue retention: 92-98%
- Net revenue retention: 105-125%
- Monthly churn: 0.5-1.5%
The pattern is clear: higher ACV = better retention. Enterprise customers have higher switching costs and longer commitments.
Efficiency Benchmarks
CAC Payback Period:
- Best-in-class: <10 months
- Healthy: 10-15 months
- Acceptable: 15-20 months
- Concerning: >20 months
LTV:CAC Ratio:
- Best-in-class: >5:1
- Healthy: 3-5:1
- Acceptable: 2.5-3:1
- Unsustainable: <2.5:1
Magic Number (efficiency of growth spend):
- Efficient growth: >0.75
- Acceptable: 0.5-0.75
- Inefficient: <0.5
Magic Number = Net New ARR ÷ (Prior Quarter S&M Spend)
Product Engagement Benchmarks
DAU/MAU Ratio:
- Collaboration tools: 40-60%
- Productivity tools: 25-40%
- Analytics platforms: 20-35%
- Invoicing/admin tools: 10-25%
Time to Value:
- PLG products: <1 hour
- SMB products: <1 day
- Mid-market: <1 week
- Enterprise: <30 days
Feature Adoption:
- Core features: 70-90% of active users
- Advanced features: 20-40%
- New features (first 90 days): 10-25%
How to Use These Benchmarks
Don’t obsess over hitting every benchmark perfectly.
Instead, use them to:
- Identify your biggest weakness: Where are you furthest from benchmark?
- Set realistic goals: If you’re at 75% GRR and benchmark is 90%, aim for 82% next quarter
- Justify investment: “Our CAC payback is 18 months vs. 12-month benchmark. Here’s why we should invest in organic to improve that.”
- Track improvement: Are you moving toward benchmark or away from it?
Remember: benchmarks are industry averages. Top performers beat them significantly. But you need to walk before you run.
Avoiding Common SaaS SEO Pitfalls
Even with the right metrics in place, many SaaS companies sabotage their organic growth by making preventable mistakes. I’ve documented the most common SaaS SEO mistakes that drain budgets and waste time.
The biggest mistake? Treating SEO metrics as separate from business metrics. Everything I’ve covered in this guide only works if you connect organic performance to actual revenue outcomes.
Taking Action: Your Next Steps
Look, I’ve just thrown a lot of metrics at you.
MRR, ARR, churn, LTV, CAC, NRR, GRR, payback periods, LTV:CAC ratios, engagement scores, feature adoption, health scores…
It’s overwhelming. I get it.
But here’s the thing: you don’t need to track all of these perfectly starting tomorrow.
You need to start somewhere. Pick the metrics that matter most for your stage and your biggest growth challenges right now.
If you’re pre-$1M ARR: Focus on MRR growth, customer acquisition cost, and basic churn. Get those three right and you’ll survive long enough to worry about the sophisticated stuff.
If you’re $1M-$10M ARR: Add LTV:CAC ratio, CAC payback period, and Net Revenue Retention. You need to prove your unit economics work before you can scale.
If you’re $10M+ ARR: You should be tracking all of this, segmented by cohort, channel, and customer segment. If you’re not, you’re flying a $10M+ plane without instruments.
The 30-Day Metrics Implementation Plan
Week 1: Audit what you’re tracking now
- List every metric you currently track
- Identify gaps in your data infrastructure
- Choose 5-7 core metrics to prioritize
Week 2: Set up tracking infrastructure
- Connect billing system to metrics platform
- Implement UTM tracking for organic traffic
- Set up CRM source attribution
- Tag customers by acquisition channel
Week 3: Baseline your current performance
- Calculate your current metrics
- Document your methodology
- Create simple dashboards (even if it’s just spreadsheets)
Week 4: Analyze and plan
- Compare your metrics to benchmarks
- Identify your biggest gaps
- Create action plan to improve your weakest metrics
Then repeat monthly. Track trends. Make adjustments. Improve.
When to Bring in Help
Some of this stuff is complex. Especially connecting SEO attribution to revenue outcomes and building channel-specific LTV models.
If you’re struggling to:
- Set up proper attribution tracking
- Calculate metrics accurately
- Connect your marketing data to financial outcomes
- Build a data stack that scales with your growth
That’s literally what I help SaaS companies do as a startup SEO consultant and AI SEO consultant.
I work with growth teams to build measurement frameworks that actually drive decisions. Not vanity dashboards. Not metrics for the sake of metrics. Real infrastructure that connects your SEO and content efforts to MRR, churn, and LTV.
Whether you need help with startup SEO strategy, AI search optimization, or building a complete organic growth engine, I can help you connect the dots between rankings and revenue.
Because at the end of the day, metrics only matter if they change how you allocate resources.
The Bottom Line
SaaS metrics aren’t about perfection. They’re about direction.
Are you moving toward product-market fit or away from it? Are your unit economics improving or deteriorating? Are your best customers coming from organic channels or paid channels?
The companies that win in SaaS are the ones that obsess over these questions. They measure relentlessly. They segment everything. They calculate channel-specific returns and reallocate budget accordingly.
They don’t chase vanity metrics. They track revenue outcomes.
And that’s exactly what separating the SaaS companies that IPO from the ones that shut down in year three.
So pick your metrics. Build your dashboards. Start tracking.
Your future self (and your bank account) will thank you.
SaaS SEO Metrics Frequently Asked Questions
What’s the difference between MRR and ARR, and which should I track?
MRR (Monthly Recurring Revenue) measures your predictable monthly revenue stream. ARR (Annual Recurring Revenue) is simply MRR × 12.
Track MRR for month-to-month operational decisions and ARR when talking to investors or comparing against industry benchmarks. Most SaaS companies under $10M ARR focus primarily on MRR because it’s more granular and actionable. Larger companies use ARR as their primary metric because it’s the standard for valuation and benchmarking.
The key is tracking MRR movement. the components of new, expansion, and churned MRR that explain why your number changed month to month.
What’s considered good churn for a SaaS company?
It depends entirely on your market segment and pricing.
Enterprise SaaS (annual contracts over $50K): 5-10% annual churn is acceptable. SMB SaaS (monthly contracts under $5K): 20-30% annual churn is realistic. The higher your price point and longer your contracts, the lower your churn should be.
More important than absolute churn rate is the trend: is churn increasing or decreasing? And what’s your Net Revenue Retention? If you’ve got 25% logo churn but 110% NRR due to expansion revenue, that’s actually healthy growth.
Track churn by cohort and acquisition channel to understand which customer segments stick around and which don’t.
How do I calculate Customer Lifetime Value accurately?
The basic formula is: CLV = (ARPA × Gross Margin %) ÷ Monthly Churn Rate
But this assumes static churn and no expansion revenue, which underestimates CLV for healthy SaaS companies.
A more sophisticated approach: CLV = (ARPA × Gross Margin %) ÷ (Monthly Churn Rate – Monthly Expansion Rate)
If you’ve got negative net churn (expansion exceeds churn), this formula accounts for the compounding value of customers who grow their spending over time.
For maximum accuracy, calculate CLV by cohort and acquisition channel. You’ll find that different customer segments have dramatically different lifetime values.
What’s the ideal LTV:CAC ratio for SaaS?
The industry standard target is 3:1, meaning each customer generates three times their acquisition cost in lifetime value.
Ratios below 2.5:1 indicate you’re spending too much to acquire customers (or they’re churning too fast). Ratios above 5:1 might mean you’re underinvesting in growth and could profitably spend more on acquisition.
The sweet spot for most healthy SaaS companies is 3-5:1.
Calculate this separately by acquisition channel. I consistently see organic search delivering 5-6:1 ratios while paid channels deliver 2.5-3:1 ratios. This channel-specific insight should drive your budget allocation decisions.
How long should my CAC Payback Period be?
For most SaaS companies, target 12-15 months.
Product-led growth (PLG) companies with self-service models should aim for under 12 months. Enterprise SaaS with longer sales cycles can justify 18-24 months but need strong NRR to make it work.
Anything over 24 months creates serious cash flow constraints unless you’ve got substantial capital reserves.
Shorter payback periods give you more flexibility to invest in growth because you’re recovering acquisition costs faster. This is one reason organic acquisition is so valuable, content costs amortize over many months, creating very favorable payback periods.
Should I track Gross Revenue Retention or Net Revenue Retention?
Track both, but for different purposes.
Gross Revenue Retention (GRR) tells you what percentage of revenue you’re keeping before expansion. It’s your baseline retention reality and reveals product-market fit independent of expansion efforts.
Net Revenue Retention (NRR) tells you whether your customer base is growing or shrinking in value. It’s what investors care about because it indicates whether you can grow without constant new acquisition.
Healthy SaaS companies achieve high GRR (90%+) and high NRR (110%+). This combination means you’re retaining customers well and expanding them effectively.
What SaaS metrics should I show investors?
Investors want to see the fundamentals of your business model:
Financial: ARR, ARR growth rate, MRR breakdown (new/expansion/churn), gross margin Efficiency: CAC, LTV, LTV:CAC ratio, CAC payback period, Magic Number Retention: Net Revenue Retention, Gross Revenue Retention, logo retention Overall health: Rule of 40 score, burn multiple (if pre-profitable)
Present these as trends over time (last 12 months minimum) and include cohort analysis showing whether your metrics are improving or deteriorating.
Most importantly: don’t hide bad metrics. Investors will find them during diligence. Show you understand your challenges and have plans to address them.
How do I connect SEO metrics to these business outcomes?
This is where most SaaS companies fail. They track SEO in isolation from business metrics.
The solution: build attribution tracking from organic visitor → lead → customer → revenue.
Tag organic traffic with UTM parameters. Track which content drives conversions in your CRM. Calculate the LTV of customers acquired through organic channels. Measure organic-specific CAC by dividing your total SEO/content investment by organic customers acquired.
Then compare organic performance against other channels using the same metrics: CAC, LTV, LTV:CAC ratio, churn rate, expansion rate.
When you prove organic delivers better unit economics than paid channels (which it almost always does), budget allocation decisions become obvious.
What’s the minimum viable metrics stack for an early-stage SaaS company?
You don’t need enterprise-grade tools on day one, but you do need the basics:
Revenue metrics: Baremetrics or ProfitWell (connects to Stripe) Web analytics: Google Analytics (free) Product analytics: Mixpanel free tier or basic Amplitude CRM: HubSpot free tier or Pipedrive (to track leads and customers)
That stack costs under $200/month and gives you MRR, churn, LTV, organic traffic attribution, and basic product usage data.
As you scale past $1M ARR, upgrade to ChartMogul for revenue analytics and proper BI tooling (Looker, Metabase) for custom dashboards.
But early on, just make sure you’re tracking the basics accurately. Perfect is the enemy of done.