If you want to know how to track AI traffic in GA4, you’re in the right place.
LLM platforms like ChatGPT and Perplexity are driving more referral traffic than ever before. And if you’ve been working on your AI search visibility, you need to measure what’s actually working.
The problem? Google Analytics doesn’t make it easy to track AI referral traffic out of the box.
In this guide, I’ll show you exactly how to set up custom reports to monitor traffic from AI search engines, create segments that filter LLM platforms, and even build a Looker Studio dashboard to visualize your data.
Let’s get into it.
Why Tracking AI Traffic Matters
Here’s the thing.
AI search is growing fast. More people are using ChatGPT, Perplexity, Claude, and other AI tools to find information instead of traditional search engines.
In 2024, ChatGPT reached over 180 million users, with its web referral traffic growing by more than 40% year-over-year, according to Similarweb.
If you’re not tracking this traffic, you’re flying blind.
You need to know:
- Which AI platforms are sending you the most visitors
- How engaged those visitors are
- Whether they’re converting into leads or customers
- Which pages perform best for AI traffic
Without this data, you can’t optimize your generative engine optimization strategy or prove ROI to stakeholders.
Setting Up Your AI Traffic Exploration Report
The first step is creating a custom exploration report in GA4.
Step 1: Create a Blank Exploration
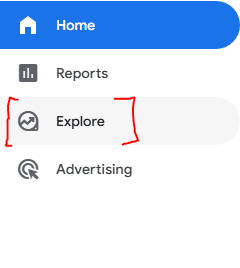
Head to the Explorations tab in Google Analytics and create a blank report.
Name it something simple like “AI Traffic.”
Step 2: Add Your Metrics
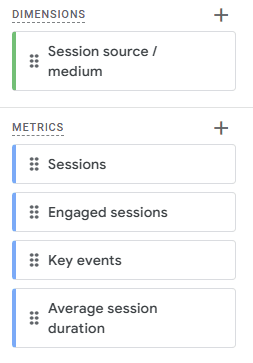
You’ll want to track four key metrics:
Sessions – Total visitors from AI platforms who landed on your site and stayed for at least 15 seconds.
Engaged Sessions – Visitors who took an action like clicking an internal link, watching a video, or triggering another event.
Key Events – Your conversion events (form submissions, phone calls, specific button clicks, etc.).
Average Session Duration – How long visitors spend on your site on average.
These metrics give you a complete picture of how AI traffic performs compared to your traditional organic search efforts.
Step 3: Create Your AI Traffic Segment
This is where the magic happens.
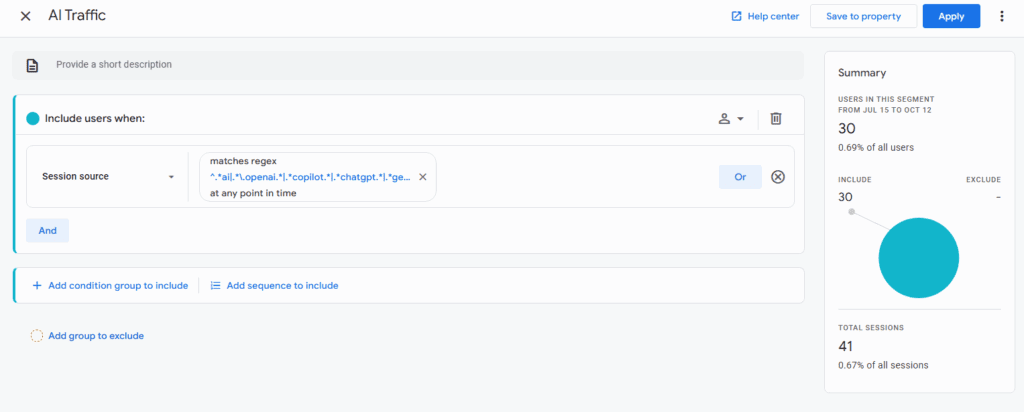
Click to create a new user segment. Then add a condition with these settings:
- Dimension: Session Source
- Filter: Matches regex
- Value: (paste the regex code:)
.chatgpt.com.|.perplexity.|.edgepilot.|.edgeservices.|.copilot.microsoft.com.|.openai.com.|.gemini.google.com.|.nimble.ai.|.iask.ai.|.claude.ai.|.aitastic.app.|.bnngpt.com.|.writesonic.com.|.copy.ai.|.chat-gpt.org.The regex code should include: perplexity, chatgpt, gemini, bard, copilot, claude, and other LLM platforms.
Name this segment “AI Traffic” and save it.
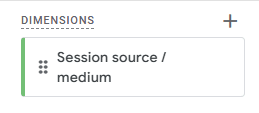
Step 4: Add Session Source Dimension
Import the “Session Source / Medium” dimension to your report.
Drag it into the rows section (not columns).
Then add your four metrics to the values section.
Now you can see exactly which AI platforms are sending you traffic and how that traffic performs.
Understanding the Data
Here’s something important to know.
Google Analytics struggles to properly categorize AI referral traffic. You’ll see traffic labeled as:
- Referral
- Direct
- Not set
This happens because Google doesn’t have a standardized way to track AI platforms yet.
But with your custom segment, you’ll capture all of it regardless of how it’s categorized.
Tracking AI Overviews and AI Mode in Google Search Console
Google recently consolidated AI Overview and AI Mode data in Search Console.
But there’s no simple filter to view only this traffic.
Here’s how to fix that.
Creating the AI Overview Filter
Go to your Search Console property and click “Add Filter.”
Select “Query” and choose “Custom (regex).”
Paste in a regex pattern that filters for longer, conversational queries (minimum 3 words) ([^” “]*\s){2,}?.
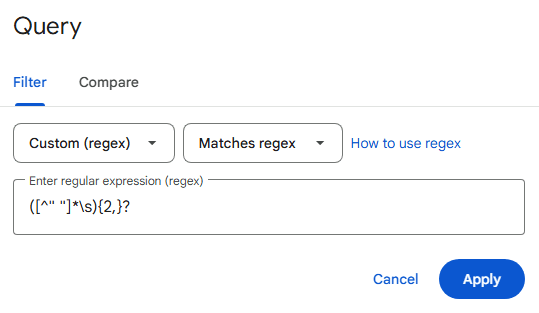
Why? Because AI Overview and AI Mode queries tend to be longer and more conversational than traditional searches. People ask full questions instead of typing short keywords.
You can adjust the word count minimum in the regex code based on your needs.
Once you apply the filter, you’ll see clicks and impressions specifically from AI-driven search experiences.
This gives you insights into which queries trigger AI citations and how much traffic they drive. If you want to improve your visibility here, check out my guide on how to rank for AI Overviews.
Building a Looker Studio Dashboard
If you want a live, visual report to share with your team, Looker Studio is the way to go.
It auto-updates and looks professional.
Step 1: Connect Your Data Sources
Add both Google Analytics and Google Search Console as data sources.
Step 2: Create Scorecards for Key Metrics
Add scorecards for:
- Total sessions from AI traffic
- Engaged sessions
- Average session duration
- Key events (conversions)
For each scorecard, apply your AI traffic filter using the same regex code from earlier.
Step 3: Add Visual Elements
Create a donut chart showing the percentage breakdown of traffic from each AI platform.
Add a table that shows:
- Landing pages
- Sessions per page
- Engaged sessions per page
- Key events per page
This helps you identify which content performs best with AI traffic.
Step 4: Customize and Share
Make it look clean. Add your branding. Set the date range to auto-update.
Then share it with stakeholders who need regular updates on AI performance.
What the Data Tells You
Once you’re tracking everything, you’ll start noticing patterns.
Some AI platforms send highly engaged traffic. Others send more visitors but with lower engagement.
You might find that ChatGPT traffic converts differently than Perplexity traffic.
Or that certain pages consistently rank well in AI citations while others don’t get picked up at all.
This is where understanding LLM SEO vs traditional SEO becomes crucial.
Use these insights to:
- Double down on platforms that send quality traffic
- Optimize pages that already perform well in AI search
- Identify content gaps where you could improve AI visibility
- Run competitive analysis to see how competitors appear in AI results
Tips for Better AI Traffic Tracking
A few things I’ve learned from doing this:
Update your regex regularly. New AI platforms launch constantly. Add them to your filter as they gain traction.
Compare time periods. Look at month-over-month or quarter-over-quarter trends to see if your AI optimization efforts are working.
Don’t ignore low engagement. If AI traffic has high bounce rates, your content might not match user intent. Fix that by writing better SEO content that answers questions directly.
Track by landing page. Some pages will naturally perform better in AI search. Find out which ones and create more content like them.
Focus on conversational keywords. When doing keyword research for SEO, prioritize long-tail, question-based queries that AI tools are more likely to surface.
Optimizing for AI Search Engines
Tracking is only half the battle.
Once you know which pages get AI traffic, you need to optimize for better visibility.
The key is understanding how to rank in AI search engines.
Focus on:
- Clear, direct answers to common questions
- Structured data and schema markup
- Authoritative, well-researched content
- Strong internal linking structure
- Citations and sources that AI models trust
AI platforms prioritize content that’s factual, well-organized, and easy to parse. Give them exactly that.
The Bottom Line
Learning how to track AI traffic in GA4 is essential if you want to stay competitive in 2025 and beyond.
Traditional SEO isn’t dead, but AI search is growing fast. You need to measure what’s working so you can optimize accordingly.
Set up your GA4 exploration report, create your filters, and build a dashboard you can reference regularly.
The data will guide your strategy and help you prove the value of AI search optimization to your team or clients.
Want help improving your overall SEO visibility and AI search performance? Check out my free video SEO audit where I provide tailored, in-depth recommendations specifically for your brand.